

Bitcoin chart and trades with the DTM system
Follow up on yesterdays Bitcoin chart: The H4 fast trendline held support and a new demand zone has created. On H1 also the demand zone held the price and pushed it back a bit…
I took a trade on the 1 minute chart when the FOLLOW THE TREND got green and a confirmation arrow showed up and closed it when i went to sleep…
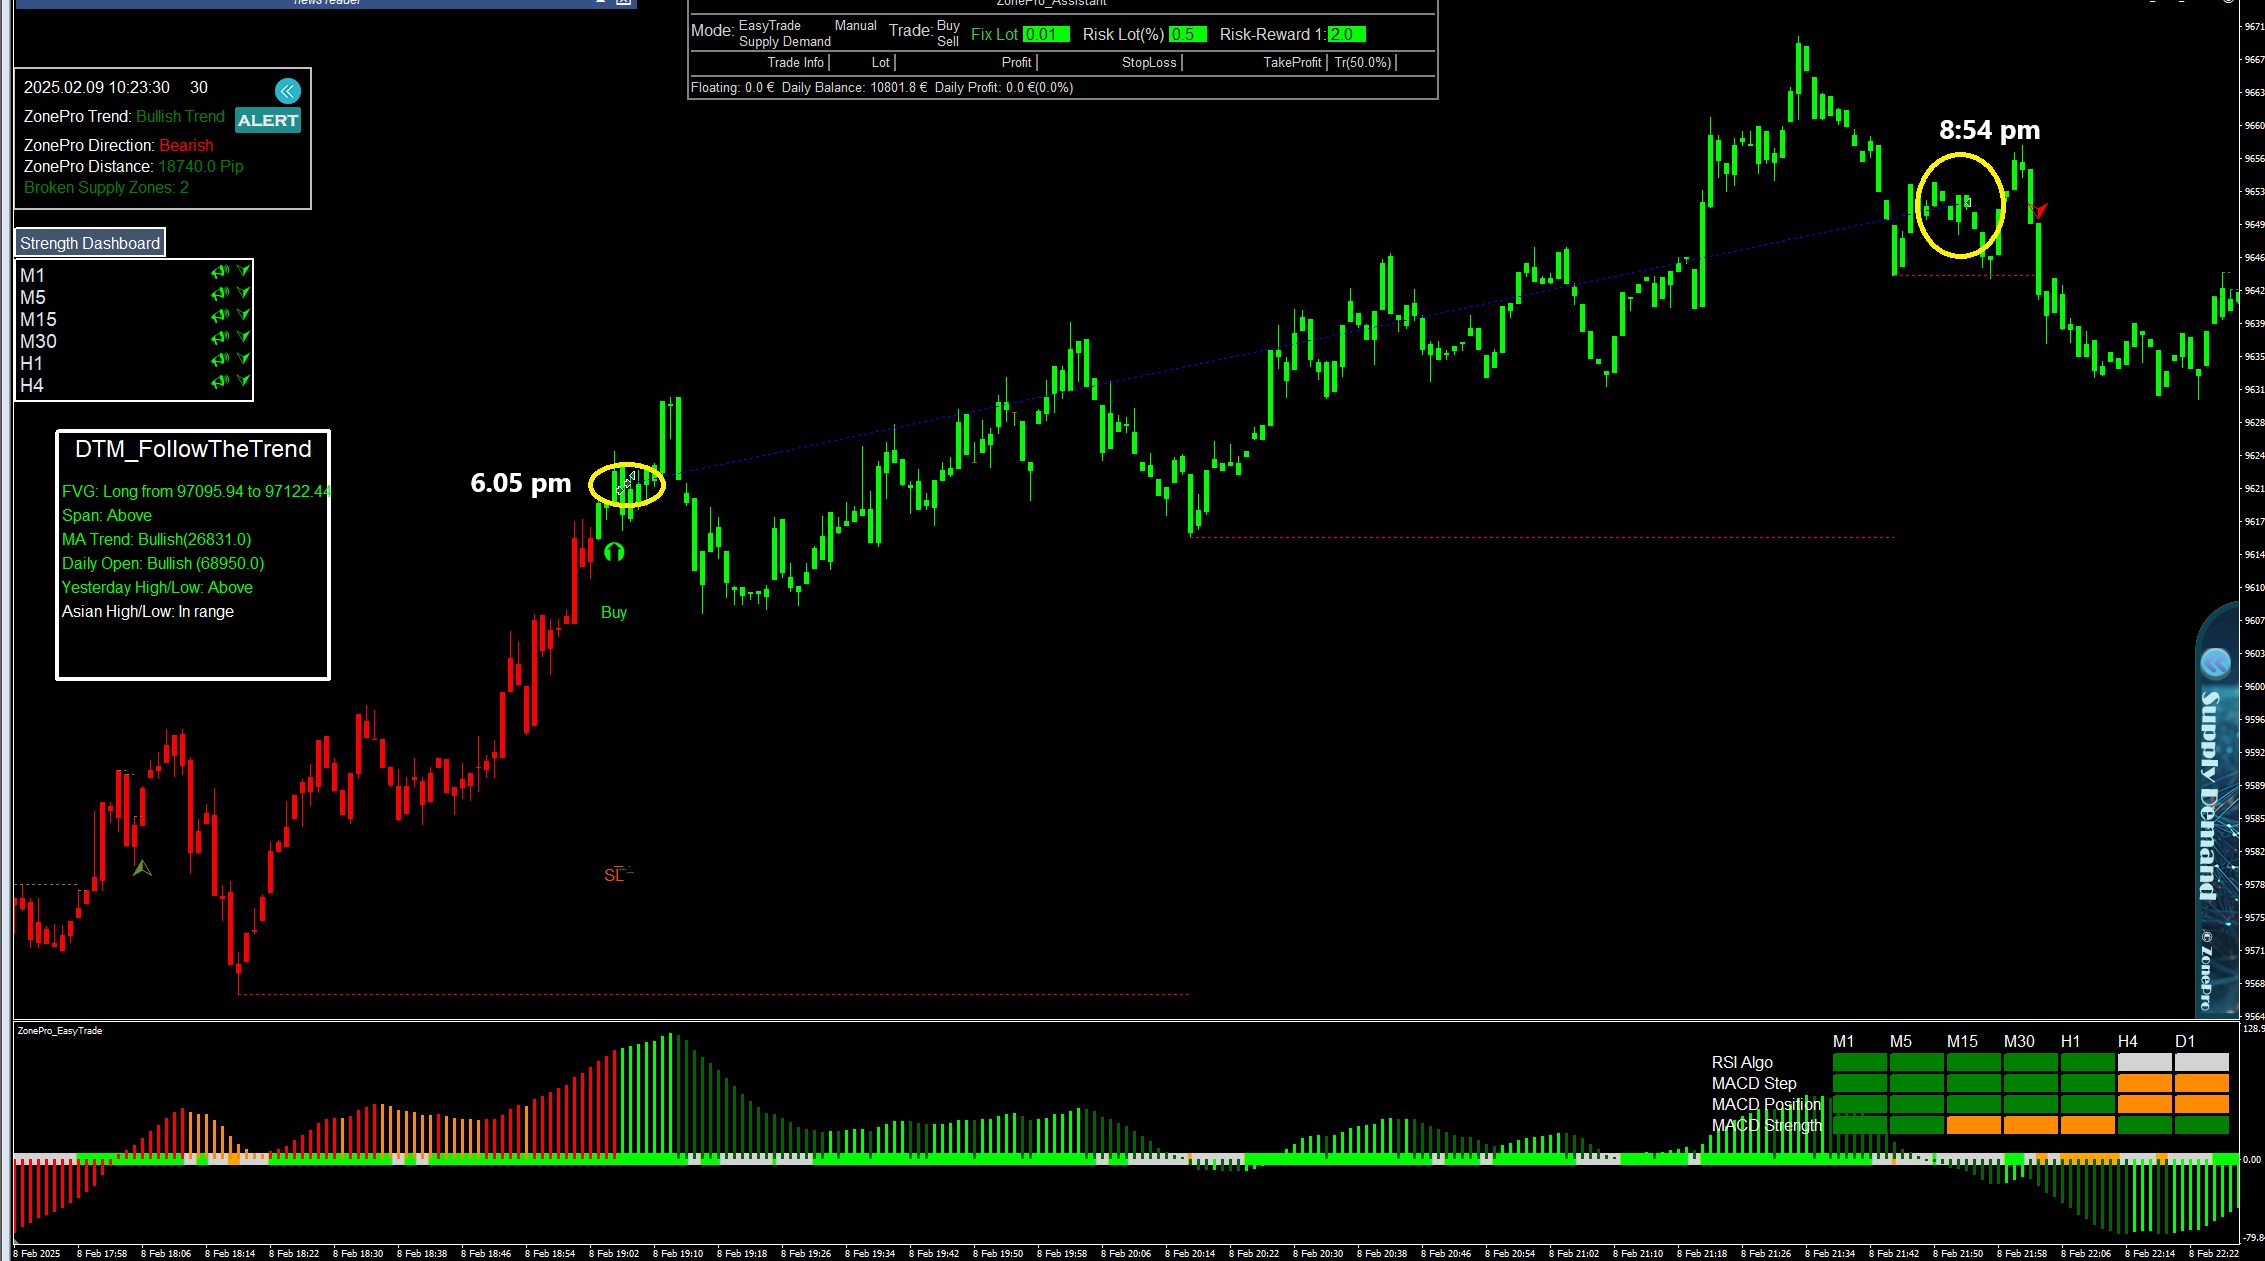
This morning the bullish momentum, was still on….i show you an example of a long trade with easytrade That occured at around 7 am………..you see that we have a red candle section from the FOLLOW THE TREND but no confirmation arrow so that section is not alive yet!!!
We get an EASYTRADE GREEN ARROW AND THE HISTOGRAM BELOW IS IN GREEN TOO SO ITS GOOD TO TAKE THE TRADE!

Trade could be exited at that strong supply zone or we could wait till a RED Easytrade arrow appears
Enjoy trading and have a good weekend!